
Example DEXA 3D Report




- Date:
- 22 April 2025
- Tests:
- 3D Body Scan, DEXA Body Composition
Body Fat
Your Results
| Height | 168 cm | |
| Weight | 68.0 kg | |
| Body Fat Weight | 18.48 kg | |
| Body Fat Percentage | 27.2% | Average |
| BMI | 23.8 kg/m² | Normal |
Fat Mass Index (FMI)
The Fat Mass Index (FMI) measures your body fat relative to your height, providing a more accurate assessment of body fat. It accounts for differences in body size, as fat mass proportions vary between taller and shorter people.
6.45 kg/m²
44/100 – compared to other 39 year old females
Fat Mass Index (FMI)
Optimal: 5 – 8 kg/m²Maintain balanced macronutrients and regular training.
This range supports healthy ageing by minimising fat-driven inflammation while preserving lean mass.Visceral Fat
Visceral fat is fat stored around your internal organs. While a small amount is normal, excess levels can increase your risk of heart disease, stroke, and type 2 diabetes. The NHS considers less than 100 cm² a healthy level, but for optimal long-term metabolic health, we recommend aiming for below 80 cm².
Your metabolic age reflects how your visceral fat compares with people of the same age and sex in our UK database
+ 5 years
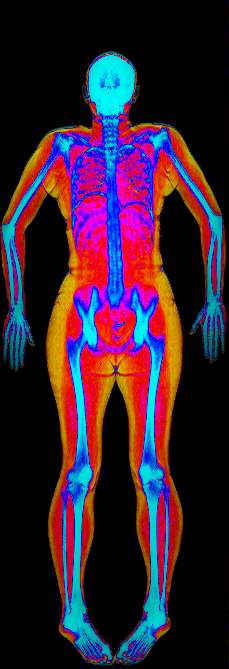
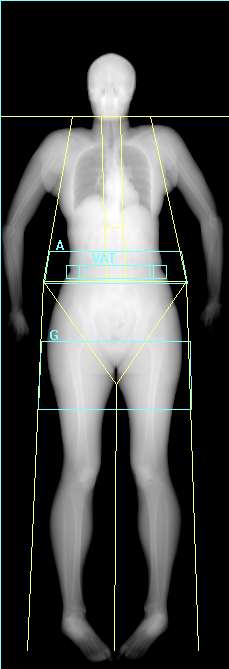
Your Visceral fat measurement is 58.8 cm²
Compared to others the same age and sex
65/100 – compared to other 39 year old females
Visceral Fat
Optimal: 10 – 80 cm²Continue moderate-intensity exercise and monitor waist circumference.
Staying in this range supports metabolic flexibility and lowers risk of insulin resistance with age.Lean Mass
Your total lean mass and its comparison to other 39 year old females provides valuable insight into overall body composition and muscle health. Lean mass represents metabolically active tissue, including skeletal muscle, organs, and connective tissue.
Maintaining healthy lean mass supports physical performance, healthy ageing. Monitoring lean mass percentage, and ALMI helps assess muscle health and changes over time
+ 2 years
Your Results
| Lean Mass Weight | 47.25 kg |
| Lean Mass Percentage | 69.6% |
Lean Mass in Arms & Legs (ALMI) 6.93 kg/m²
ALMI measures the amount of muscle in your arms and legs in relation to your height, allowing for meaningful comparisons between people of different body sizes. Values below 5.45 kg/m² indicate an increased risk of sarcopenia. Our longevity target is above 6.95 kg/m².
42/100 - compared to other 39 year old females
| Lean Mass Index (LMI) | 16.5 kg/m² |
| Lean Mass Index Percentile | 53 / 100 |
Lean Mass in Arms & Legs (ALMI)
Optimal: ≥ 6.95 kg/m²Increase your protein intake and consider regular resistance training.
Low lean mass in your arms and legs is a key marker for Sarcopenia, which accelerates biological ageing.Aim to gain 60 g of lean muscle before your next review.
Lean Mass Distribution
Your lean mass and how it is distributed throughout your body provides a valuable insight into muscle health, strength, and physical function. Assessing lean mass across your arms, legs, and trunk can help identify muscular imbalances, monitor training adaptations, and detect changes in muscle over time.
Low lean mass is associated with an increased risk of frailty, fractures, metabolic disorders such as type 2 diabetes, and reduced physical function with ageing.
Arms
71/100
Trunk
74/100
Legs
51/100
Compared to other 39 year old females. These are not adjusted for height, so they are best used for spotting imbalances between body parts rather than comparing your overall muscle level to others.
Imbalance
Your muscle symmetry from left to right.
| Left | Imbalance | Right | |
|---|---|---|---|
| Arms | 2.28 kg | 2.36 kg | |
| Legs | 7.44 kg | 7.76 kg |
Muscle Symmetry
Optimal: < 15% imbalanceInclude unilateral exercises (working one side of the body at a time) and maintain proper technique in your training.
Symmetry supports joint health and efficient movement, helping sustain functional longevity.Bone Density
Your Bone Health Age compares your bone density with other 39 year old Females from the BodyView UK reference database of over 48,700 DEXA scans.
Your T-score compares your bone density to a 25 year old Female's bone density, while your Z-score compares you with healthy adults of the same age and sex using the NHANES reference database. Different reference populations may produce different results.
+ 5 years
T-Score is 0.2
Your Z-Score is 0
WHO Classification
Normal Bone Density
Bone Mineral Density
Optimal: Z-score ≥ 0Continue resistance and impact activities; monitor BMD annually if at risk.
Maintaining healthy bone density reduces fracture risk, helping preserve mobility, independence, and quality of life.The World Health Organization (WHO) defines osteoporosis and osteopenia based on T-scores:
Osteoporosis
T-score of -2.5 or lower
Osteopenia (low bone density)
T-score between -1 and -2.5
Normal bone density
T-score above -1
Please Note: Full-body bone density scans provide an overall indication of bone health, but for a definitive bone health assessment please arrange a DEXA Osteo Scan.
Whole Body Bone Density
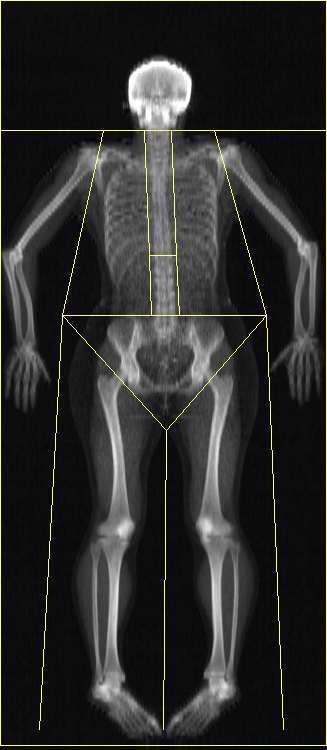
Your bone mineral density is 1.118 g/cm²
| Region | Area (cm²) | BMC (g)¹ | BMD (g/cm²)² | T-Score | Z-Score |
|---|---|---|---|---|---|
| Left Arm | 219.04 | 155.85 | 0.712 | – | – |
| Right Arm | 239.4 | 175.09 | 0.731 | – | – |
| Left Ribs | 118.48 | 81.82 | 0.691 | – | – |
| Right Ribs | 107.89 | 75.4 | 0.699 | – | – |
| Thoracic Spine | 145.75 | 130.67 | 0.897 | – | – |
| Lumbar Spine | 54.56 | 55.77 | 1.022 | – | – |
| Pelvis | 181.17 | 230.63 | 1.273 | – | – |
| Left Leg | 374.16 | 412 | 1.101 | – | – |
| Right Leg | 382.71 | 426.34 | 1.114 | – | – |
| Subtotal | 1823.15 | 1743.58 | 0.956 | – | – |
| Head | 212.52 | 531.54 | 2.501 | – | – |
| Total | 2035.67 | 2275.12 | 1.118 | 0.2 | 0 |
¹ The weight of the minerals in your bones.
² A measure of bone strength. Higher BMD generally means stronger bones and a lower risk of fractures.
DEXA Scan Body Composition Results
| Lean Mass | % Lean | Fat Mass² | % Fat³ | Bone Mass | Total Mass⁴ | ||||
|---|---|---|---|---|---|---|---|---|---|
| Left Arm | 2.28 kg | 63.1 | 1.18 kg | 32.6 | 155.85 g | 3.61 kg | |||
| Right Arm | 2.36 kg | 61.4 | 1.32 kg | 34.2 | 175.09 g | 3.84 kg | |||
| Trunk | 24.76 kg | 74.4 | 7.99 kg | 24 | 574.30 g | 33.29 kg | |||
| Left Leg | 7.44 kg | 65.5 | 3.48 kg | 30.7 | 412 g | 11.36 kg | |||
| Right Leg | 7.76 kg | 65 | 3.74 kg | 31.3 | 426.34 g | 11.93 kg | |||
| Subtotal | 44.60 kg | 69.6 | 17.70 kg | 27.6 | 1743.58 g | 64.04 kg | |||
| Head | 2.65 kg | 66.7 | 771 g | 19.4 | 531.54 g | 3.97 kg | |||
| Android ¹ | – | – | 0 g | – | – | – | |||
| Gynoid ¹ | – | – | 0 g | – | – | – | |||
| Total | 47.25 kg | 69.5 | 18.48 kg | 27.2 | 2275.12 g | 68.01 kg |
¹ Android (Belly), Gynoid (Bum, hips and thighs) are sub-regions of the body, whose fat masses are already included in the Sub-total and Total figures.
² The total amount of fat in grams.
³ The percentage of the total mass that is fat.
⁴ The total combined weight of fat, muscle, and bone.
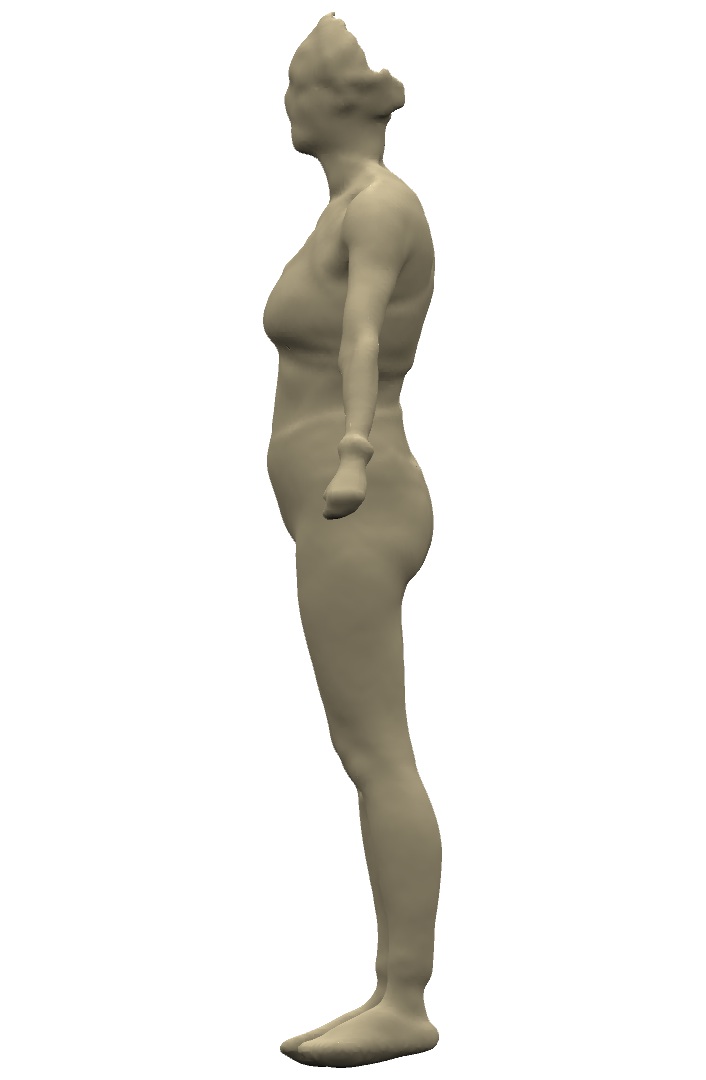
3D Body Scan Results
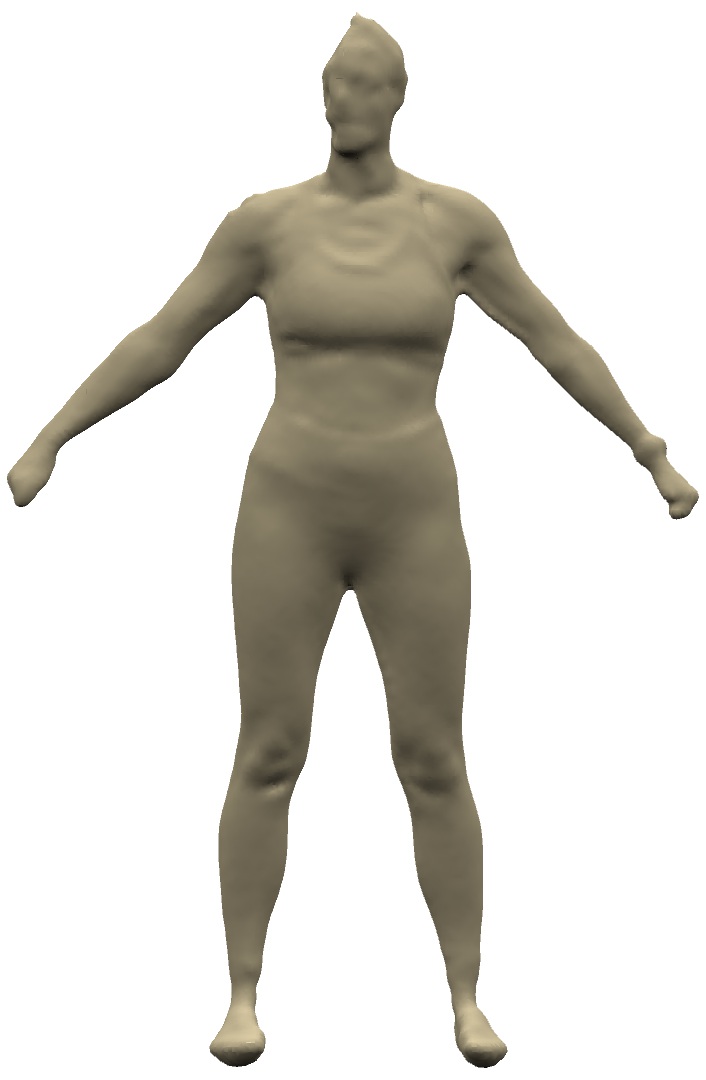
3D body scanning provides highly accurate and detailed measurements of body parameters, including circumferences, lengths, and volumes. This precision surpasses traditional measurement methods, allowing for more accurate tracking of changes in body composition over time.
Front View
Side View
3D Body Scan Results
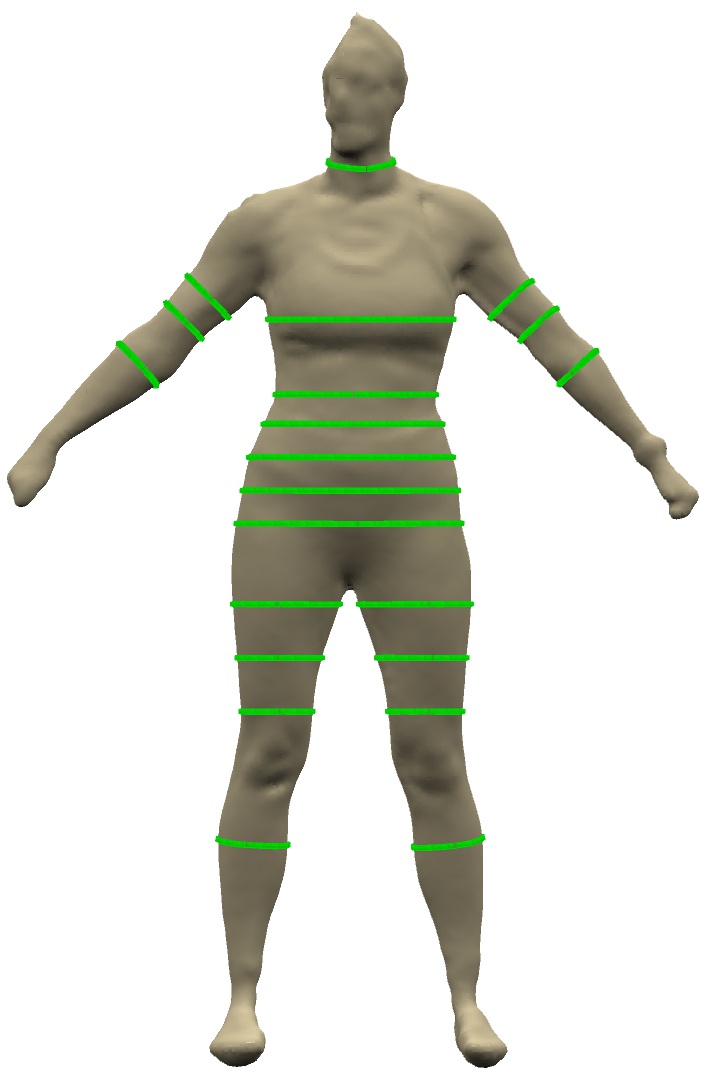
Upper Body Measurements
| Neck | 30.2 cm |
| Chest | 88.4 cm |
| Bicep (L) | 25.2 cm |
| Bicep (R) | 27.7 cm |
| Bicep Lower (L) | 22.2 cm |
| Bicep Lower (R) | 24.7 cm |
| Forearm (L) | 21.4 cm |
| Forearm (R) | 24.4 cm |
| Waist (Narrowest) | 69.6 cm |
| Waist (Abdominal) | 74.7 cm |
| Waist (Lower) | 88.6 cm |
Lower Body Measurements
| High Hip | 93 cm |
| Hip | 95.8 cm |
| Upper Thigh (L) | 53.6 cm |
| Upper Thigh (R) | 52.9 cm |
| Mid Thigh (L) | 49 cm |
| Mid Thigh (R) | 48.2 cm |
| Lower Thigh (L) | 38.9 cm |
| Lower Thigh (R) | 38 cm |
| Calf (L) | 34.1 cm |
| Calf (R) | 33.7 cm |
Fitness & Metabolism
Physical Activity Level
Adjust the activity level to recalculate maintenance calories.
RMR Calories1374 kcal
Your BodyView estimated resting metabolic rate is calculated from your body composition using BodyCompPro's advanced algorithms, delivering over 20% greater accuracy than traditional methods.
Maintenance Calories1649 kcal
This is your RMR plus the energy you burn through daily activity and exercise, giving the total number of calories you need to eat each day to maintain your current weight.
Calorie Breakdown
Your Maintenance Calories are made up of your RMR plus the extra calories you burn through daily activity.
Muscle Gain (12 Weeks)60 g
Aim to gain 60 g of lean muscle before your next review through consistent training and nutrition.
VO2 Max Indicator37 - 46 mL/kg/min
Your fitness level is estimated from your body composition using BodyCompPro's advanced algorithms.
Your Estimate Is
Excellent
*Please Note: For a more precise assessment of your cardiovascular fitness, we recommend an RMR and VO2 max test.
Body Composition Age
Using BodyView's UK reference database of over 48,700 gold standard DEXA scans, BodyCompPro compares your body composition with age and sex matched adults to calculate four Body Composition Ages.
Compare these with your chronological age of 39 years to see which areas are aging faster or slower than expected.
Metabolic Health Age
Derived from your visceral fat levels, metabolic age reflects how efficiently your body manages fat storage around vital organs. Visceral fat accumulates around key organs and is closely linked to metabolic disease risk, lower visceral fat indicates a younger metabolic age.
+ 5 years
Muscle Health Age
Based on the lean mass in your arms & legs relative to your height (ALMI), muscle age shows how your muscle mass compares to others of the same age and sex. Maintaining muscle mass is key to long-term strength and function.
+ 2 years
Overall Bone Health Age
Calculated from your whole-body bone density Z-score, bone age reflects the biological age of your skeleton relative to population norms for your age and sex. Healthy bone density reduces fracture risk and supports long-term mobility. We recommend having a hip and spine scan if you are concerned about osteoporosis.
+ 5 years
Your Overall Results
Body Composition Age combines your Metabolic, Bone and Muscle Health Ages into a single overall measure of body composition health. It is calculated using a weighted algorithm developed from BodyView's leading UK reference database.
+ 4 years
43
Longevity Health Index
The Longevity Health Index turns your scan data into a personalised roadmap for better health and performance.
By measuring key markers such as lean muscle, visceral fat, and bone density against science-backed targets, it provides a clear picture of your health today - and how to improve it for tomorrow.
| Metric | Result | Target | Points | Progress |
|---|---|---|---|---|
| Visceral Fat | 58.8 cm² | < 80 cm² | 37 / 37 | 100% |
| Lean Mass in Arms & Legs | 6.93 kg/m² | > 6.95 kg/m² | 22.45 / 24 | 94% |
| Bone Mineral Density* | 0 | >= 0 | 18 / 18 | 100% |
| Fat Mass Index (FMI) | 6.45 kg/m² | 5 – 8 kg/m² | 13 / 13 | 100% |
| Muscle Symmetry | 7.84 % | < 20 % | 8 / 8 | 100% |
*This score reflects the overall bone density of the entire body, offering a general overview. For detailed information, a dedicated scan of the hip and spine is required.
Overall Score
Longevity Health Index
Very Strong
98
/ 100
Personal Action Plan
| Focus Area | Status | Advice |
|---|---|---|
| Visceral Fat | Healthy | Continue moderate-intensity exercise and monitor waist circumference.Staying in this range supports metabolic flexibility and lowers risk of insulin resistance with age. |
| Lean Mass in Arms & Legs (ALMI) | Below Optimal | Increase your protein intake and consider regular resistance training.Low lean mass in your arms and legs is a key marker for Sarcopenia, which accelerates biological ageing. Aim to gain 60 g of lean muscle before your next review. |
| Bone Mineral Density | Healthy | Continue resistance and impact activities; monitor BMD annually if at risk.Maintaining healthy bone density reduces fracture risk, helping preserve mobility, independence, and quality of life. |
| Fat Mass Index (FMI) | Healthy | Maintain balanced macronutrients and regular training.This range supports healthy ageing by minimising fat-driven inflammation while preserving lean mass. |
| Muscle Symmetry | Healthy | Include unilateral exercises (working one side of the body at a time) and maintain proper technique in your training.Symmetry supports joint health and efficient movement, helping sustain functional longevity. |
Visceral Fat
Continue moderate-intensity exercise and monitor waist circumference.
Staying in this range supports metabolic flexibility and lowers risk of insulin resistance with age.
Lean Mass in Arms & Legs (ALMI)
Increase your protein intake and consider regular resistance training.
Low lean mass in your arms and legs is a key marker for Sarcopenia, which accelerates biological ageing.
Aim to gain 60 g of lean muscle before your next review.
Bone Mineral Density
Continue resistance and impact activities; monitor BMD annually if at risk.
Maintaining healthy bone density reduces fracture risk, helping preserve mobility, independence, and quality of life.
Fat Mass Index (FMI)
Maintain balanced macronutrients and regular training.
This range supports healthy ageing by minimising fat-driven inflammation while preserving lean mass.
Muscle Symmetry
Include unilateral exercises (working one side of the body at a time) and maintain proper technique in your training.
Symmetry supports joint health and efficient movement, helping sustain functional longevity.
Review In
July
2025
A Huge Thanks
Thank you for visiting BodyView. We appreciate your business and are comitted to helping you achieve your goals. If you need any further assistance, please get in touch. If you enjoyed your experience, we'd be grateful if you could leave us a review on Trustpilot or Google.
Kindest RegardsTeam BodyView

BodyCompPro
This report was compiled using BodyCompPro software for DEXA scanners, providing you with gold standard results interpreted through the most advanced body composition software available.
Disclaimer
The information provided is for general guidance and not a substitute for professional advice. Always consult a healthcare professional before starting any fitness or weight loss program, especially if you have health conditions or take medications. Use the information at your own discretion and responsibility.