
Example DEXA Body & Bone Report
Sample Report
Date of Birth: 15 May 1990


- Date:
- 22 April 2025
- Tests:
- DEXA Body Composition, DEXA Osteo Scan
22 April 2025
DEXA Body & Bone
Carried out by John


DEXA Scan BMI Classification
About BMI
- BMI stands for Body Mass Index. It originates from observations in the 1830s of a population of mainly white European men.
- Your BMI is calculated from your weight and height and is a simple - and blunt - method of assessing whether your weight is "normal" for your height.
- Because it is ultimately based on your weight, BMI cannot differentiate between fat and muscle mass, so often categorises muscular individuals as overweight or obese.
- It also does not account for your fat distribution, which is crucial for assessing health risks, as fat in the upper body and abdomen increases the risk of life-changing diseases, such as type-2 diabetes and cardiovascular disease.
Your Results
| Height | 168 cm |
| Weight | 68.0 kg |
| BMI | 23.8 kg/m² |
| Classification | Normal |
Normal Weight
- Lower risk of obesity-related health conditions
- Reduced risk of cardiovascular diseases
- Improved overall health and longevity
DEXA Scan Body Fat
| Body Fat Percentage | 27.2% |
| Body Fat Weight | 18.48 kg |
How You Compare to Others
The graph opposite provides a standardised measure accounting for age and sex in the UK, leading to more accurate and clinically relevant assessments compared to BMI and body fat classifications.
Fat Mass Index (FMI)
The Fat Mass Index (FMI) shows how much fat your body has relative to your height. If you are taller, the fat spreads out more, and if you're shorter, it's more packed in.
6.45 kg/m²
Normal Range: 5 – 8 kg/m²
44/100 – compared to other 39 year old females
Body Fat Classifications
| Classification | % Body Fat |
|---|---|
| Essential | 10 – 14% |
| Athletic | 14 – 21% |
| Fit | 21 – 25% |
| Average | 25 – 32% |
| Above Average | 32 – 39% |
| Obese | 39+% |
DEXA Scan Visceral Fat
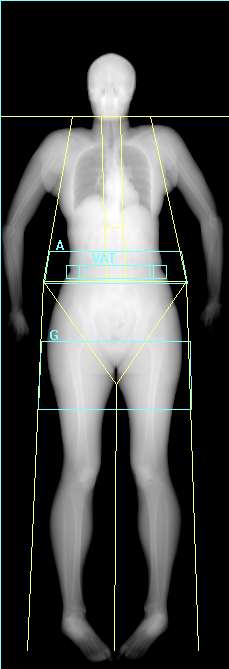
Visceral fat, sometimes called "spillover" fat, builds up around internal organs like the liver and pancreas once subcutaneous fat stores are full.
While some is protective, too much increases the risk of heart disease and diabetes.
A healthy measurement for you would be < 100 cm².
Your Visceral fat measurement is 58.8 cm²
Normal risk for metabolic disorders, cardiovascular diseases.
Compared to others the same age and sex
66/100 – compared to other 39 year old females
Maintenance
- Maintain a balanced diet
- Regular physical activity
- Monitor body composition
DEXA Scan Lean Mass
| Lean Mass Percentage | 69.6% |
| Lean Mass Weight | 47.25 kg |
Lean Mass Index (LMI)
The Lean Mass Index (LMI) shows how much lean mass your body has relative to your height. If you are taller, the lean mass spreads out more, and if you're shorter, it's more packed in.
16.5 kg/m²
53/100 - compared to other 39 year old females
Average LMI
Represents a balanced lean mass relative to height, supporting healthy metabolism, physical function, and long-term resilience when fat mass is also well-managed.
Recommendation
Maintain regular resistance training, ensure dietary protein is adequate, and recheck DEXA every 3 – 6 months to track trends in muscle and fat.
Appendicular Lean Mass Index (ALMI)
The Appendicular Lean Mass Index (ALMI) shows how much muscle your arms and legs have relative to your height. Values below 5.45 kg/m² can be associated with Sarcopenia (Muscle atrophy).
6.93 kg/m²
42/100 - compared to other 39 year old females
Average ALMI
Reflects a healthy, balanced amount of limb muscle relative to your size. It's a positive sign for functional strength and metabolic health, especially if maintained with low visceral fat.
Recommendation
Maintain with consistent strength training, sufficient protein, and periodic reassessment to ensure muscle quality and fat balance remain optimal over time.
DEXA Scan Lean Mass Distribution
Your lean mass and how it's distributed across your body can be useful if you are trying to balance your muscle groups, or partake in particular activities that require higher regional concentrations.
Abnormally low muscle mass can also lead to increased risk of fractures, dementia, and metabolic disorders including Type 2 diabetes.
Imbalance
The table below shows your muscle symmetry from left to right.
| Left | Imbalance | Right | |
|---|---|---|---|
| Arms | 2.28 kg | 2.36 kg | |
| Legs | 7.44 kg | 7.76 kg |
Your lean mass and how it compares to others in the UK of the same age and sex broken down into regions.
Arms
71/100
Trunk
74/100
Legs
51/100
Compared to other 39 year old females.
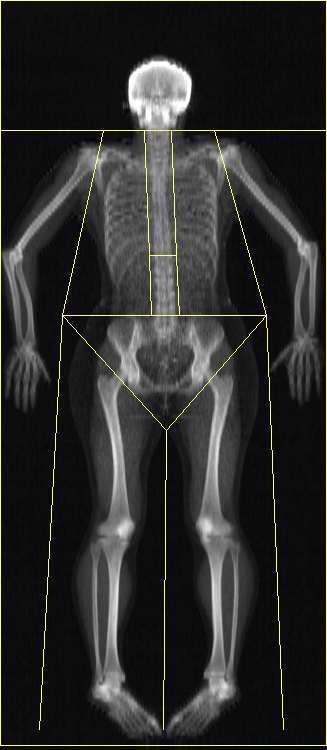
DEXA Scan Body Composition Results
| Lean Mass | % Lean | Fat Mass | % Fat | Bone Mass | Total Mass² | ||||
|---|---|---|---|---|---|---|---|---|---|
| Left Arm | 2.28 kg | 63.1 | 1.18 kg | 32.6 | 155.85 g | 3.61 kg | |||
| Right Arm | 2.36 kg | 61.4 | 1.32 kg | 34.2 | 175.09 g | 3.84 kg | |||
| Trunk | 24.76 kg | 74.4 | 7.99 kg | 24 | 574.30 g | 33.29 kg | |||
| Left Leg | 7.44 kg | 65.5 | 3.48 kg | 30.7 | 412 g | 11.36 kg | |||
| Right Leg | 7.76 kg | 65 | 3.74 kg | 31.3 | 426.34 g | 11.93 kg | |||
| Subtotal | 44.60 kg | 69.6 | 17.70 kg | 27.6 | 1743.58 g | 64.04 kg | |||
| Head | 2.65 kg | 66.7 | 771 g | 19.4 | 531.54 g | 3.97 kg | |||
| Android ¹ | – | – | 0 g | – | – | – | |||
| Gynoid ¹ | – | – | 0 g | – | – | – | |||
| Total | 47.25 kg | 69.5 | 18.48 kg | 27.2 | 2275.12 g | 68.01 kg |
¹ Android (Belly), Gynoid (Bum, hips and thighs) are sub-regions of the body, whose fat masses are already included in the Sub-total and Total figures.
² Total Mass = Lean Mass + Fat Mass + Bone Mass.
Whole Body Bone Density
Your bone mineral density is 1.118 g/cm²
| Region | Area (cm²) | BMC (g) | BMD (g/cm²) | T-Score | Z-Score |
|---|---|---|---|---|---|
| Left Arm | 219.04 | 155.85 | 0.712 | – | – |
| Right Arm | 239.4 | 175.09 | 0.731 | – | – |
| Left Ribs | 118.48 | 81.82 | 0.691 | – | – |
| Right Ribs | 107.89 | 75.4 | 0.699 | – | – |
| Thoracic Spine | 145.75 | 130.67 | 0.897 | – | – |
| Lumbar Spine | 54.56 | 55.77 | 1.022 | – | – |
| Pelvis | 181.17 | 230.63 | 1.273 | – | – |
| Left Leg | 374.16 | 412 | 1.101 | – | – |
| Right Leg | 382.71 | 426.34 | 1.114 | – | – |
| Subtotal | 1823.15 | 1743.58 | 0.956 | – | – |
| Head | 212.52 | 531.54 | 2.501 | – | – |
| Total | 2035.67 | 2275.12 | 1.118 | 0.2 | 0 |
DEXA Spine Scan Results
A spine scan, focusing on the lumbar spine, assesses bone mineral density (BMD), crucial for diagnosing osteoporosis and predicting fractures. It's particularly effective in evaluating vertebral fractures, which lead to pain, deformity, and height loss. Providing valuable insight into spine health, these scans are vital for maintaining skeletal integrity and mobility.
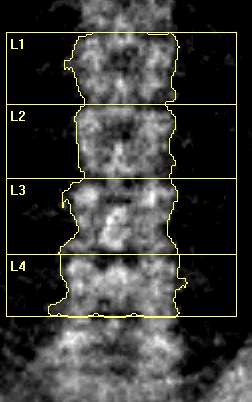
| Area (cm²) | BMC (g) | BMD (g/cm²) | T-Score | Z-Score | |
|---|---|---|---|---|---|
| L1 | 18.26 | 19.67 | 1.078 | 0 | 0.4 |
| L2 | 17.88 | 20.22 | 1.131 | 0.3 | 0.7 |
| L3 | 20.11 | 24.36 | 1.211 | 1 | 1.4 |
| L4 | 19.25 | 23.33 | 1.212 | 1.1 | 1.5 |
| Total | 75.5 | 87.58 | 1.181 | 0.6 | 0.5 |
Total BMD CV 1.0%, Age: 50, Height: 180 cm, Weight: 115.6 kg
- T-Score compares your bone density to the optimal peak bone density of a 25 year old.
- Z-Score compares your bone density to the average for people of your age and sex.
- BMC (Bone Mineral Content) is the total amount of mineral in the scanned area.
DEXA Spine Scan Results
The graph above shows how your bone density compares to the bone densities of others of the same age, gender, and ethnicity. The line through the middle shows the average for your age, with the section above showing above-average scores, and the section below showing below-average scores.
WHO Classification
- Normal bone density — T-score above -1 SD
- Osteopenia (low bone density) — T-score between -1 and -2.5 SD
- Osteoporosis — T-score of -2.5 SD or lower
T-Score is 0.6. WHO Classification: Normal Bone Density
T-scores alone do not determine fracture risk — age, sex, medical history, and lifestyle also play a role. Interpretation should be done in consultation with a healthcare professional.
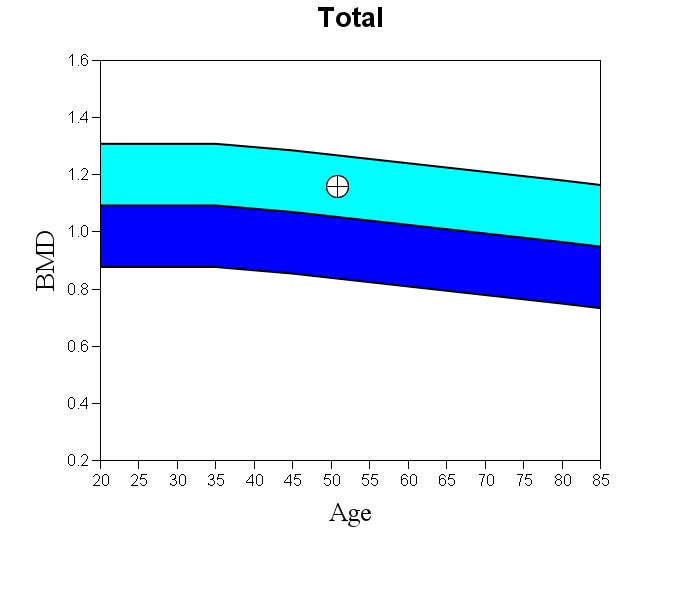
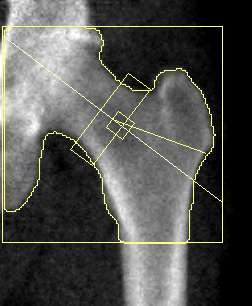
DEXA Left Hip Scan Results
Hip scans, designed to measure bone mineral density (BMD) specifically at the femoral neck, play a critical role in identifying osteoporosis-related fractures. These scans offer valuable insights into the risk of hip fractures, known for their severe repercussions like reduced mobility. Particularly crucial for older adults and individuals at risk of hip fractures, hip scans provide essential data concerning bone health in the hip region, aiding in proactive management and prevention strategies.
| Area (cm²) | BMC (g) | BMD (g/cm²) | T-Score | Z-Score | |
|---|---|---|---|---|---|
| Neck | 5.94 | 5.86 | 0.987 | 0.4 | 1.2 |
| Total | 41.98 | 49.57 | 1.181 | 1 | 1.3 |
Total BMD CV 1.0%, ACF = 1.046, BCF = 1.017, TH = 7.567, Age: 50, Height: 180, Weight: 115.6
- T-scores and Z-scores are not available for those under 20 years old and are less reliable over 85.
- FRAX Scores can only be calculated for T-score values above -2.5.
- FRAX Scores can only be calculated on hips.
DEXA Left Hip Scan Results
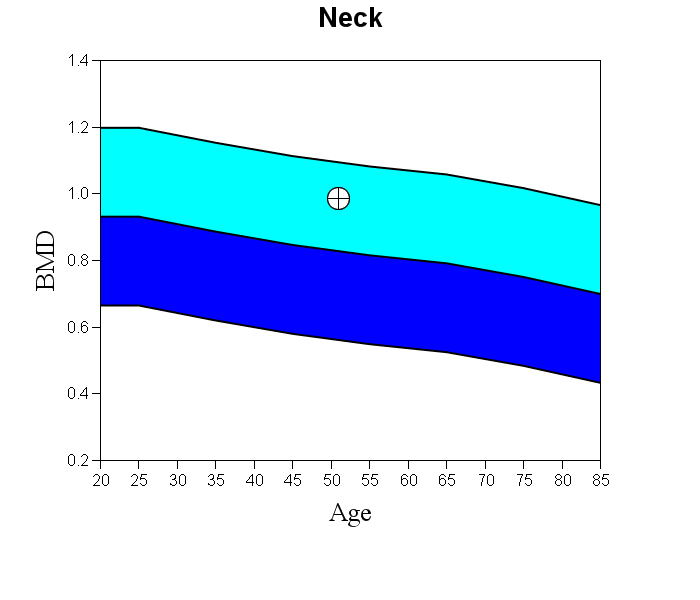
The graph above shows how your bone density compares to the bone densities of others of the same age, gender, and ethnicity. The line through the middle shows the average for your age, with the section above showing above-average scores, and the section below showing below-average scores.
WHO Classification
- Normal bone density — T-score above -1 SD
- Osteopenia (low bone density) — T-score between -1 and -2.5 SD
- Osteoporosis — T-score of -2.5 SD or lower
T-Score is 0.4. WHO Classification: Normal Bone Density
Longevity Health Index
The Longevity Health Index turns your scan data into a personalised blueprint for long-term health and performance.
It analyses key markers - lean muscle, visceral fat, and bone density - against science-backed longevity targets, then maps your results in a clear, visual dashboard to track progress.
More than a report, it's your roadmap to staying stronger, healthier, and biologically younger for longer.


| Metric | Result | Target | Points | Progress |
|---|---|---|---|---|
| Visceral Fat | 58.8 cm² | < 80 cm² | 37 / 37 | 100% |
| Appendicular LMI | 6.93 kg/m² | > 6.95 kg/m² | 22.45 / 24 | 94% |
| Bone Mineral Density* | 0 | >= 0 | 18 / 18 | 100% |
| Fat Mass Index (FMI) | 6.45 kg/m² | 5 – 8 kg/m² | 13 / 13 | 100% |
| Muscle Symmetry | 7.84 % | < 20 % | 8.00 / 8 | 100% |
*This score reflects the overall bone density of the entire body, offering a general overview. For detailed information, a dedicated scan of the hip and spine is required.
Your Personal Action Plan
To ensure you meet your goals we recommend reviewing your progress every six months, or more frequently in the vent of a 5% body fat change, as your results are likely to evolve. Additionally, if you've undergone a preventative bone scan, we suggest an annual review.
Visceral Fat
Healthy
Continue moderate-intensity exercise and monitor waist circumference.
Staying in this range supports metabolic flexibility and lowers risk of insulin resistance with age.
Appendicular LMI
Low
Increase your protein intake and consider regular resistance training.
Low appendicular mass is a key marker for Sarcopenia, which accelerates biological ageing.
Bone Mineral Density*
Healthy
Continue resistance and impact activities; monitor BMD annually if at risk.
Preserving bone density wards off osteoporotic complications that can drastically shorten lifespan.
Fat Mass Index (FMI)
Healthy
Maintain balanced macronutrients and regular training.
This range supports healthy ageing by minimising fat-driven inflammation while preserving lean mass.
Muscle Symmetry
Healthy
Maintain symmetrical programming and proper form.
Symmetry supports joint health and efficient movement, helping sustain functional longevity.
Regular Reviews
To ensure you meet your goals we recommend reviewing your progress every six months, or more frequently in the event of a 5% body fat change, as your results are likely to evolve.
Interpreting your DEXA Scan Results
BMC
BMC stands for Bone Mineral Content, and it is typically measured in grams (g). BMC refers to the total amount of minerals (primarily calcium and phosphorus) present in the bones. It is an important component of bone health assessment, along with bone mineral density (BMD).
BMD
BMD stands for Bone Mineral Density. It refers to the amount of mineral (primarily calcium and phosphorus) present in bone tissue, typically measured in grams per square centimetre (g/cm²) or grams per cubic centimetre (g/cm³). Bone mineral density is a key indicator of bone strength and density, providing valuable information about bone health.
A Huge Thanks
On behalf of the entire team at BodyView, we would like to express our appreciation for coming to see us. Your business is super important to us, and we are deeply committed to helping you achieve your goals. Should you require any further assistance, please do not hesitate to reach out; we are here to help. If your experience with us has been a positive one, it would be really appreciated if you could take a moment to share your feedback by leaving a review on Trustpilot or Google.
Kindest Regards
Team BodyView

This report was compiled using BodyCompPro software for DEXA scanners, providing you with gold standard results interpreted through the most advanced body composition software available.
Disclaimer
The information provided is for general guidance and not a substitute for professional advice. Always consult a healthcare professional before starting any fitness or weight loss program, especially if you have health conditions or take medications. Use the information at your own discretion and responsibility.